File:Courbe_niveau.svg · Wikimedia Commons · See Wikimedia Commons
contour line
Sign in to saveAlso known as isopleth, isoline, isoquant, isarithm
curve joining points with equal value on a 2D graphic representation
A contour line is a curve drawn on a map or chart that connects all points having the same value, such as elevation or temperature. Contour lines help visualize how a quantity changes across a geographic area, making it easier to spot patterns and understand the landscape or data at a glance.
AI-generated from the Wikipedia summary — may contain errors.
In the Vinony graph
Within Vinony's link graph, contour line is referenced by 576 other articles, and connects out to sea level, air pollution and topography.
It sits within the topics Cartography, Curves and Multivariable calculus.
Its subject is documented across 60 Wikipedia language editions.
Described at
All right, you must think I'm off my rocker at last. Contour lines? This list of 60 nouns beginning with "iso" defines words for contour lines on maps and diagrams that connect points having some feature (climatic, geographic, etc.) in common - also known as isolines or isograms . I wouldn't have thought there were so many of them before undertaking this site, but now that I've found them, I've become rather attached to them. So, now for my anecdote about isograms. When I was in high school (in south-central Ontario, Canada), my friends and I developed a particular isogram known as 'the stupid line'. This line demarcated the point north of which congenital idiots were found in great frequency (i.e. redneck country). The phrase 'north of the stupid line' came to signify an individual of subnormal intelligence and general social ignorance. So, what do you think of "isomoron"? Let me know.
Excerpt from a page describing this subject · 15,839 chars · not written by Vinony
Wikidata facts
- Subclass of
- line
- Image
- Courbe niveau.svg
- Has use
- cartography
Show 8 more facts
- Stack Exchange tag
- stackoverflow.com/tags/contour
- topic's main category
- Category:Contour lines
- Commons category
- Contour lines
- different from
- contour line
- on focus list of Wikimedia project
- Wikipedia:Vital articles/Level/4
- studied by
- topography
- native label
- ἴσογράμμα
- described at URL
- phrontistery.info/contour.html
via Wikidata · CC0
~25 min read
Encyclopedic overview
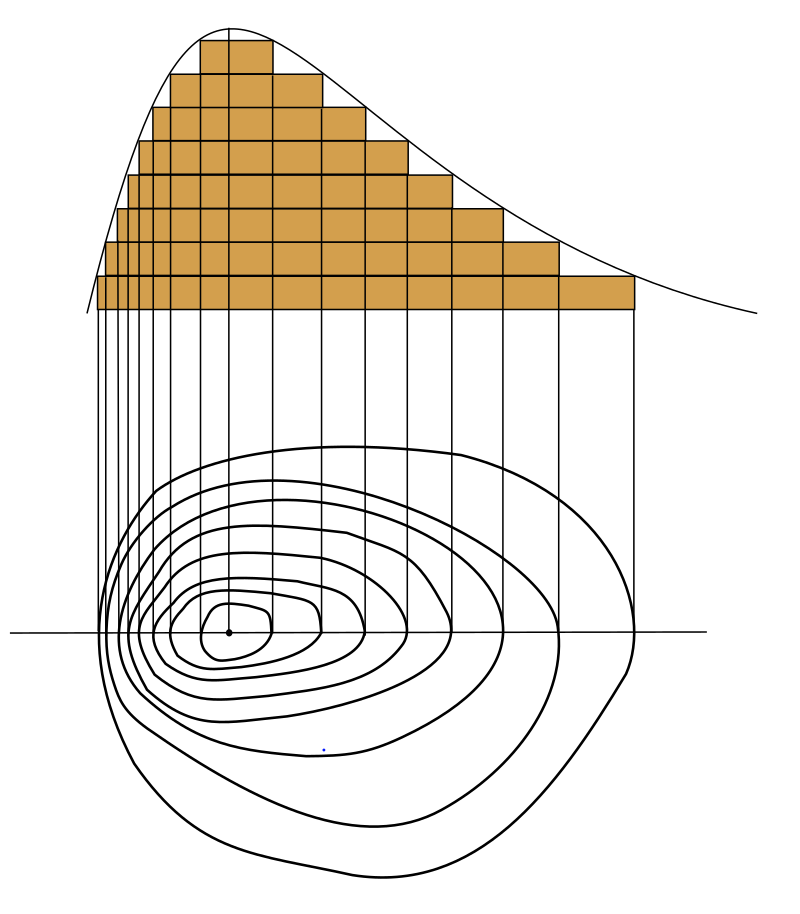
The bottom part of the diagram shows some contour lines with a straight line running through the location of the maximum value. The curve at the top represents the values along that straight line. A three-dimensional surface, whose contour graph is below. A two-dimensional contour graph of the three-dimensional surface in the above picture.
A contour line (also isoline, isopleth, isoquant or isarithm) of a function of two variables is a curve along which the function has a constant value, so that the curve joins points of equal value to the state. It is a plane section of the three-dimensional graph of the function
Excerpted from Wikipedia’s “contour line” article, available under the CC BY-SA 4.0 licence.
Gallery (12)
Available in 60 languages
- Español
- Français
- Deutsch
- 中文
- 日本語
- Русский
- Português
- العربية
- हिन्दी
- Albanian
- Armenian
- Asturian
- Azerbaijani
- Bahasa Indonesia
- Bangla
- Bashkir
- Basque
- be_x_old
Show 41 more
- Belarusian
- Bulgarian
- Burmese
- Catalan
- Croatian
- Czech
- Esperanto
- Estonian
- Galician
- Georgian
- Haitian Creole
- Ido
- Irish
- Kazakh
- Kyrgyz
- Latvian
- Lithuanian
- Malay
- Marathi
- Nederlands
- Norwegian
- Norwegian Nynorsk
- Occitan
- Polski
- Romanian
- Serbian
- simple
- Sinhala
- Slovak
- Slovenian
- Svenska
- Swahili
- Tamil
- Tiếng Việt
- Türkçe
- Ukrainian
- Uzbek
- Wu Chinese
- zh_yue
- فارسی
- 한국어
via Wikidata sitelinks · CC0