File:Normal_distribution_50%_CI_illustration.svg · Wikimedia Commons · See Wikimedia Commons
Research
722,374 papers- Redefining the confidence interval.International journal of occupational medicine and environmental health · 2004
- A confidence interval robust to publication bias for random-effects meta-analysis of few studies.Research synthesis methods · 2021
- Confidence Interval: Advantages, Disadvantages and the Dilemma of Interpretation.Reviews on recent clinical trials · 2024
- Confidence interval of percentiles in skewed distribution: The importance of the actual coverage probability in practical quality applications for laboratory medicine.Biochemia medica · 2019
- A Confidence Interval for the Difference Between Standardized Regression Coefficients.Multivariate behavioral research · 2024
via PubMed
Wikidata facts
Show 1 more fact
- Commons category
- Confidence interval
via Wikidata · CC0
~23 min read
Article
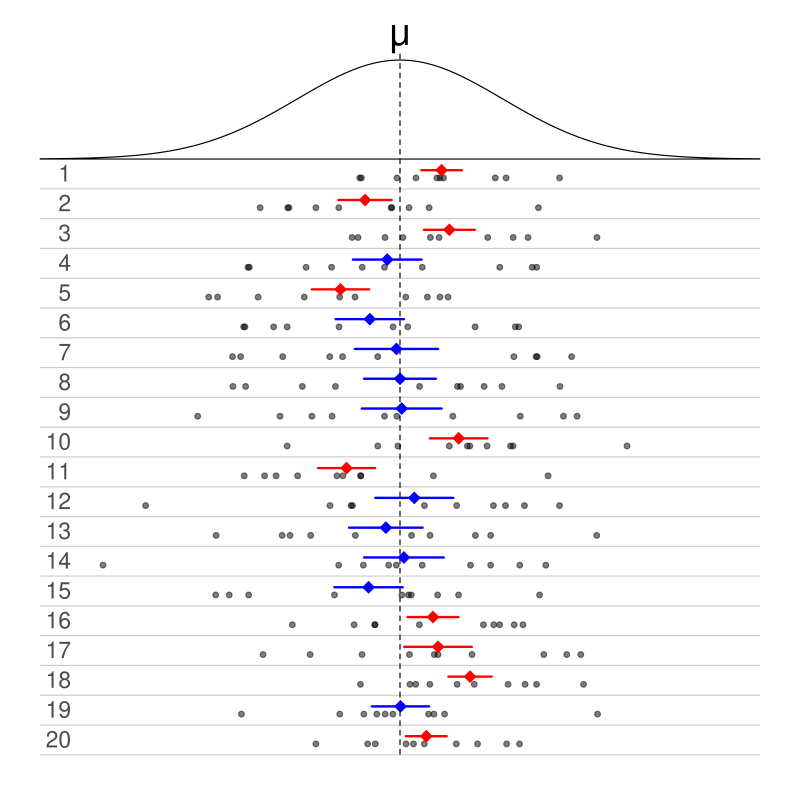
Each row of points is a sample from the same normal distribution. The colored lines are 50% confidence intervals for the population mean μ. At the center of each interval is the sample mean
x ¯
Gallery (5)
Connections
median
Entity
resampling
Entity
probability distribution
Entity
statistical population
Entity
statistical test
Entity
sampling
Entity
Pearson product-moment correlation coefficient
Entity
power of a test
Entity
simple linear regression model
Entity
trend estimation
Entity
demographic statistics
Entity
statistics
Entity
International Standard Book Number
Entity
Wayback Machine
Entity
census
Entity
digital object identifier
Entity
International Standard Serial Number
Entity
experiment
Entity
cartography
Entity
epidemiology
Entity