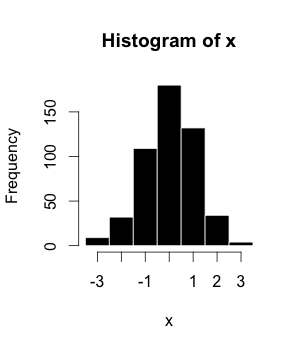
File:Example_histogram.png · Wikimedia Commons · See Wikimedia Commons
histogram
Sign in to savethumb|In this histogram, height is divided into bins of equal width (5 feet)
A histogram is a type of chart that shows how often different values appear in a set of data by dividing the data into groups (called bins) and displaying the frequency of each group as a bar. Histograms are useful because they let you quickly see patterns in data, like whether values tend to cluster in certain ranges or how the data is distributed overall.
AI-generated from the Wikipedia summary — may contain errors.
Wikidata facts
- Subclass of
- bar chart
- Part of
- statistics
- Depicts
- probability distribution
- Image
- Histogramme taille.svg
Show 6 more facts
- maintained by WikiProject
- WikiProject Mathematics
- uses
- data binning
- Commons category
- Histograms
- Stack Exchange tag
- stackoverflow.com/tags/histogram
- Commons gallery
- Histogram
- facet of
- statistics
via Wikidata · CC0
~18 min read
Encyclopedic overview
21 sectionsContents
- Etymology
- Examples
- Mathematical definitions
- Cumulative histogram
- Number of bins and width
- Square-root choice
- Sturges's formula
- Rice rule
- Doane's formula
- Scott's normal reference rule
- Terrell–Scott rule
- Freedman–Diaconis rule
- Minimizing cross-validation estimated squared error
- Shimazaki and Shinomoto's choice
- Variable bin widths
- Remark
- Applications
- See also
- References
- Further reading
- External links
thumb|In this histogram, height is divided into bins of equal width (5 feet)
A histogram is a visual representation of the distribution of quantitative data. To construct a histogram, the first step is to "bin" (or "bucket") the range of values— divide the entire range of values into a series of intervals—and then count how many values fall into each interval. The bins are usually specified as consecutive, non-overlapping intervals of a variable. The bins (intervals) are adjacent and are typically (but not required to be) of equal size.
Excerpted from Wikipedia’s “histogram” article, available under the CC BY-SA 4.0 licence.